
VitalWatch: Real-Time NCD Monitoring Platform
Download the VitalWatch Presentation
One-Line Summary: A real-time IoT platform that ingests wearable glucose and blood pressure streams into GridDB Cloud, enabling trend detection, predictive spike alerts, and doctor notifications via SMS designed for 1 lakh+ patients in underserved rural clinics.
🚨 The Problem: India’s Silent Health Emergency
The Story of Ramaiah: In a small primary health center in rural Karnataka, Dr. Meera sees 80 patients daily. She has exactly 4 minutes per patient. What she cannot see is that Ramaiah, a 54-year-old farmer, has had his fasting glucose creeping from 140 to 190 over the past three weeks. She cannot see that his blood pressure spikes to 165/105 every night around 2 AM.
Two weeks later, Ramaiah is rushed to the district hospital with diabetic ketoacidosis. This story repeats millions of times across India every year.
Why Current Approaches Fail:
- Single readings are misleading: A single fasting glucose reading tells you almost nothing about the other 23 hours.
- Data is lost: Readings are written on paper slips or isolated devices that never connect to anything.
- Doctors are overwhelmed: A rural physician managing 1,000+ chronic patients cannot possibly track each one individually without a system to flag urgent cases.
💡 Our Solution: VitalWatch
VitalWatch is built on one core belief: chronic disease management should be continuous, predictive, and proactive—not episodic, reactive, and crisis-driven.
How It Works
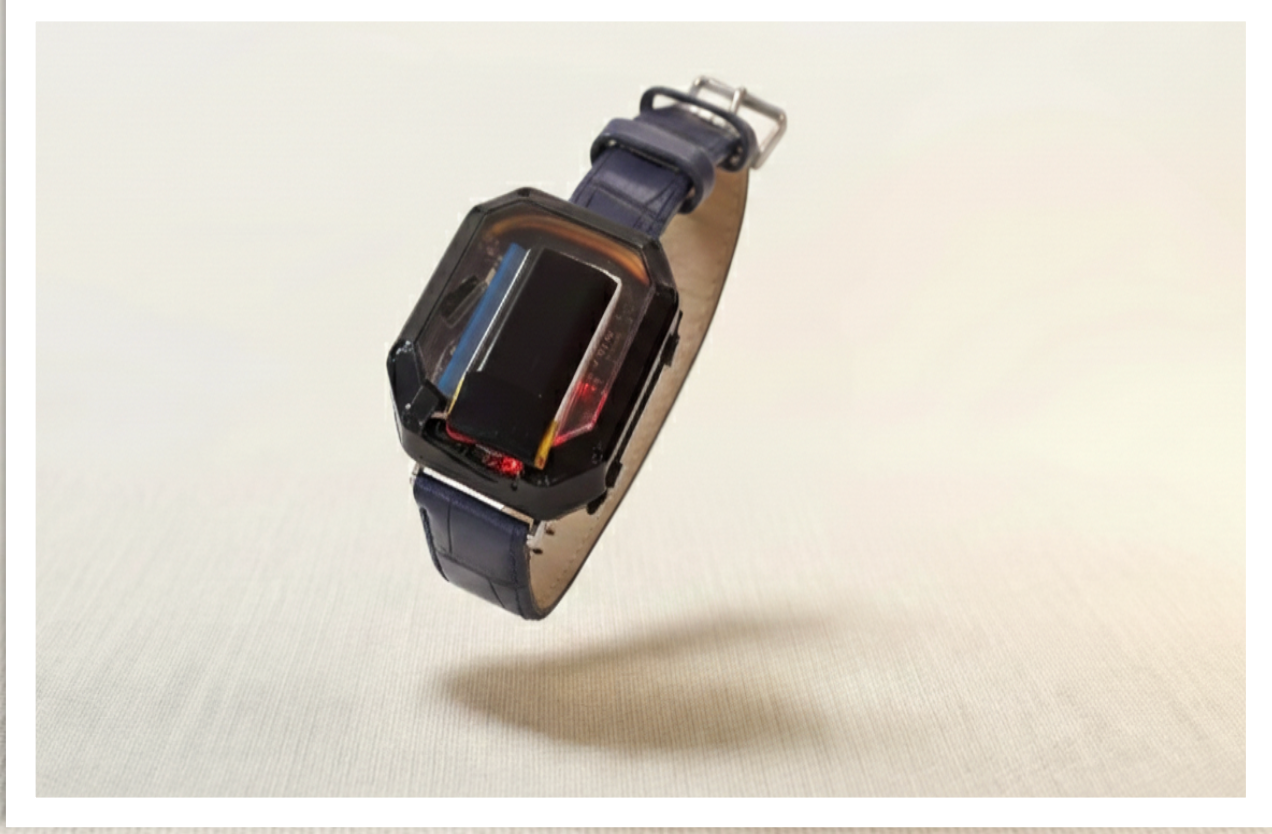
- Data Collection: Patients wear low-cost continuous glucose monitors and blood pressure wristbands.
- Transmission: Devices transmit readings via Bluetooth to a local gateway (Android phone/Hub), which publishes to an MQTT broker.
- Ingestion: A Node.js service validates and writes data into GridDB Cloud in real-time.
- Analytics: Our engine calculates rolling averages, detects anomalies, and uses predictive models to estimate spike probabilities.
- Alerting: High-risk events (e.g., glucose > 300) trigger SMS alerts to doctors via Twilio and WhatsApp messages to families.
- Visualization: Doctors access a Grafana dashboard to view patient trends and population health metrics.
🛠️ GridDB Cloud Integration
GridDB is the foundation that makes VitalWatch possible.
Why GridDB?
Chronic disease monitoring is a time-series problem. We need to answer questions like:
- “What was this patient’s average glucose over the past 7 days?”
- “Show me all readings above 200 in the past 24 hours.”
GridDB was chosen because it handles millions of time-series readings without performance degradation, unlike traditional relational databases.
Container Design
Glucose_readings(Time-Series): Stores timestamp, patient ID, glucose value (mg/dL), device ID, and meal context.BP_readings(Time-Series): Stores systolic/diastolic values, pulse rate, and body position.Alerts_log(Time-Series): Logs every system-generated alert, severity, and acknowledgement status.Patients(Collection): Master data including demographics and personalized thresholds.
💻 Tech Stack
| Component | Technology |
|---|---|
| Database | GridDB Cloud (Time-series engine) |
| Backend | Node.js (Express), GridDB-node-api |
| IoT Connectivity | MQTT.js, Eclipse Mosquitto |
| Analytics/ML | Python 3.10, Pandas, Scikit-learn (Isolation Forest), TensorFlow (LSTM) |
| Alerting | Twilio SDK (SMS), Firebase |
| Visualization | Grafana |
| DevOps | Docker, GitHub Actions |
📅 Implementation Plan
- Phase 1 (Week 1): Core Infrastructure. Set up GridDB Cloud, MQTT broker, and sensor simulator.
- Phase 2 (Week 2): Alerting System. Implement threshold alerts and Twilio integration.
- Phase 3 (Week 3): Visualization. Configure Grafana dashboards with live GridDB data.
- Phase 4 (Week 3-4): Analytics. Build Python service for rolling averages and LSTM predictive alerts.
- Phase 5 (Week 4): Polish & Documentation. Performance testing and demo recording.
🚀 Traction & Vision
- Pilot: Identifying 3 Primary Health Centers (PHCs) in Karnataka for a 500-patient pilot.
- Scale: Expand to 10,000 patients across 15 PHCs in months 4-8.
- Long-Term: Partner with state NCD programs to scale to 100,000+ patients.
Team Contact:
- Manthan V. Done (
manthandone07@gmail.com) - Omkar B. Kore (
omkarkore80.90@gmail.com)