
Smart Factory IoT Pulse
Inspiration
Factories generate massive amounts of machine data every second—status updates, production counts, energy usage, vibrations, and more. But most plants still have zero real-time visibility into what is happening on the shop floor. Machines fail silently, energy is wasted, and decisions rely on yesterday’s reports instead of today’s data.
We wanted to solve this problem by creating a single system that could bring live insights, analytics, and intelligence to any manufacturing environment.
What it does
Smart Factory IoT Pulse is a real-time machine monitoring and analytics platform powered by GridDB. It delivers:
- Live machine status (Running, Idle, Off)
- Real-time production count tracking
- Hourly and daily KPI analytics
- Energy consumption patterns
- Alerts and escalations for abnormal conditions
- Historical trends and performance charts
How we built it
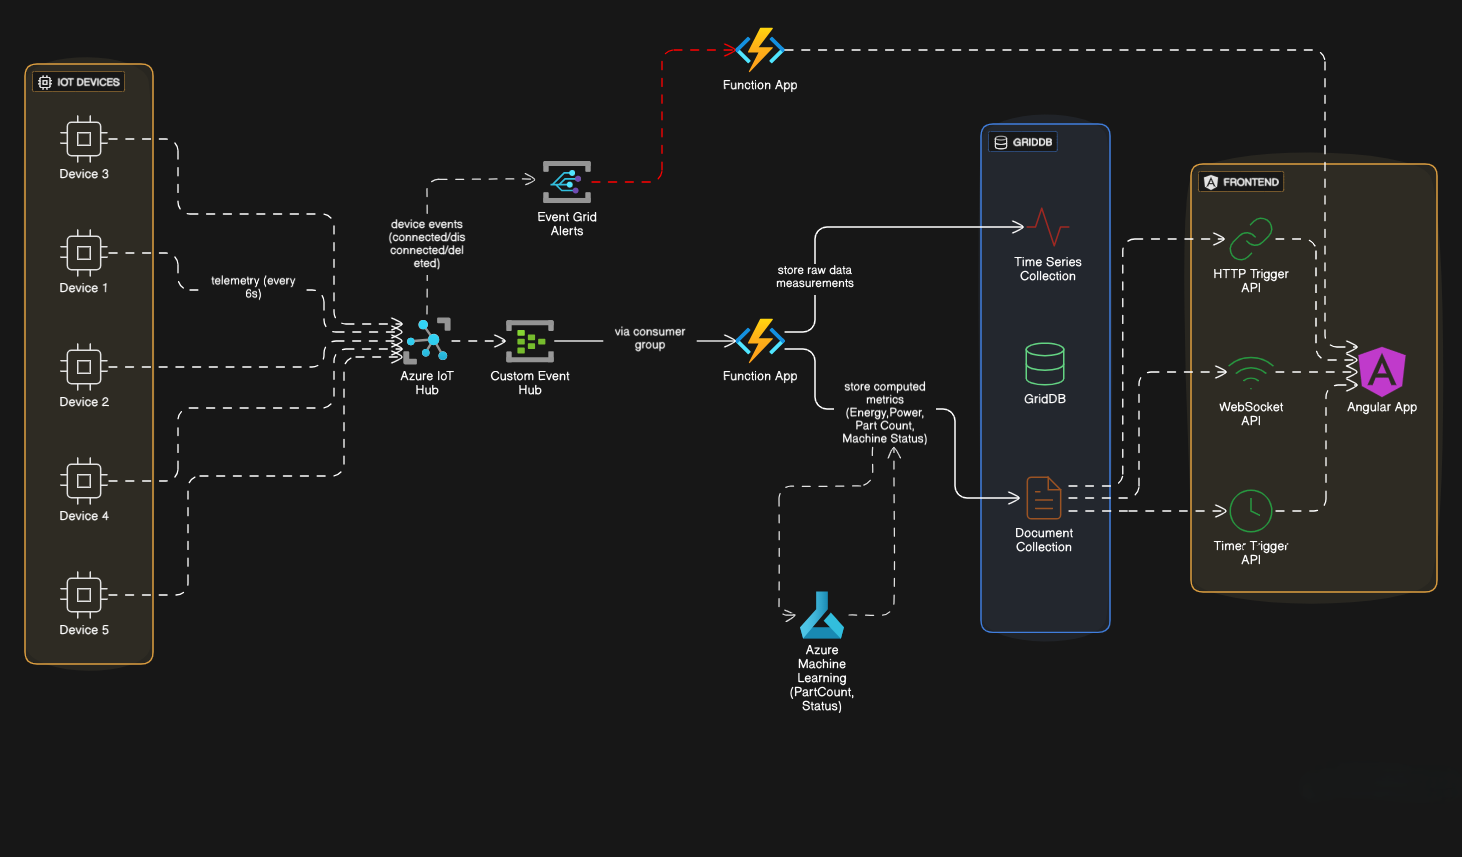
We designed a cloud-native, end-to-end IoT architecture:
- IoT Devices: Machines send telemetry every few seconds (status, counts, energy).
- Azure IoT Hub: Secure device communication via MQTT/AMQP.
- Azure Event Hub: High-throughput pipeline for streaming telemetry.
- Azure Functions:
- Ingestion Function: Parses telemetry and writes to GridDB Timeseries containers.
- Analytics Function: Computes hourly & daily KPIs and stores them in GridDB Collection containers.
- GridDB Cloud: The core time-series engine enabling fast ingestion and scalable analytics.
- API Layer (Node.js + Python): Provides endpoints for dashboards.
- Angular Frontend: Displays live machine data, charts, KPIs, and alerts.
This created a fully connected pipeline from machine → cloud → analytics → dashboard.
Challenges we ran into
- Handling high-frequency IoT data at scale without losing messages.
- Optimizing GridDB schema design, especially for timeseries containers.
- Managing low-latency ingestion inside Azure Functions.
- Designing efficient hourly/daily aggregations.
- Building dashboards that refresh seamlessly with live streaming data.
- Ensuring real-time performance even when telemetry volume spiked.
Accomplishments that we’re proud of
- Achieved smooth real-time ingestion of high-volume telemetry.
- Designed a scalable, cloud-native pipeline using Azure + GridDB.
- Built intuitive dashboards showing live production and energy insights.
- Created reliable analytics for shift-wise and daily KPIs.
- Enabled instant alerts that help prevent machine downtime.
- Demonstrated how factories can truly become Industry 4.0 ready.
What we learned
- Time-series data requires a specialized database like GridDB for performance.
- Real-time IoT systems need asynchronous, event-driven components.
- Data modeling directly affects how fast dashboards respond.
- Edge-to-cloud pipelines become powerful when analytics are automated.
- Visualizing data helps identify patterns humans miss.
- Collaboration between cloud, backend, and UI streams is essential.
What’s next for Smart Factory IOT Pulse
- Predictive maintenance using ML models.
- Anomaly detection for energy and production spikes.
- Digital twin support for virtualizing machines.
- Mobile app dashboards for on-the-go monitoring.
- Multi-factory support with centralized control rooms.
- Role-based access for operators, managers, and leadership.
- More advanced visualization like heatmaps, shift performance grids, and downtime Pareto charts.
Built With
angular.js, azure, griddb, javascript, node.js, python