
Queue Stress & Waiting-Time Drift Analyzer
Project Story
Inspiration
In many public places such as hospital OPDs, college canteens, government offices, and transport counters, people often wait in long queues. Existing queue systems usually count people or issue tokens, but they rarely measure actual waiting time or how service performance changes gradually over time. As a result, service delays and public stress are often identified only after complaints arise.
This motivated us to propose a system that focuses on waiting-time behavior and stress accumulation, rather than just queue length, using cloud-based time-series analysis.
What It Does
Queue Stress & Waiting-Time Drift Analyzer is a proposed IoT-enabled analytics system designed to measure and analyze how queue waiting time evolves over time.
The system is intended to:
- Record queue entry and exit events
- Calculate actual waiting time per person
- Store time-stamped data in GridDB Cloud
- Detect waiting-time drift, where service slows down gradually
- Estimate a Stress Index based on waiting time and queue density
- Identify stress-heavy periods and service inefficiencies
By focusing on trends rather than isolated values, the system enables proactive queue management.
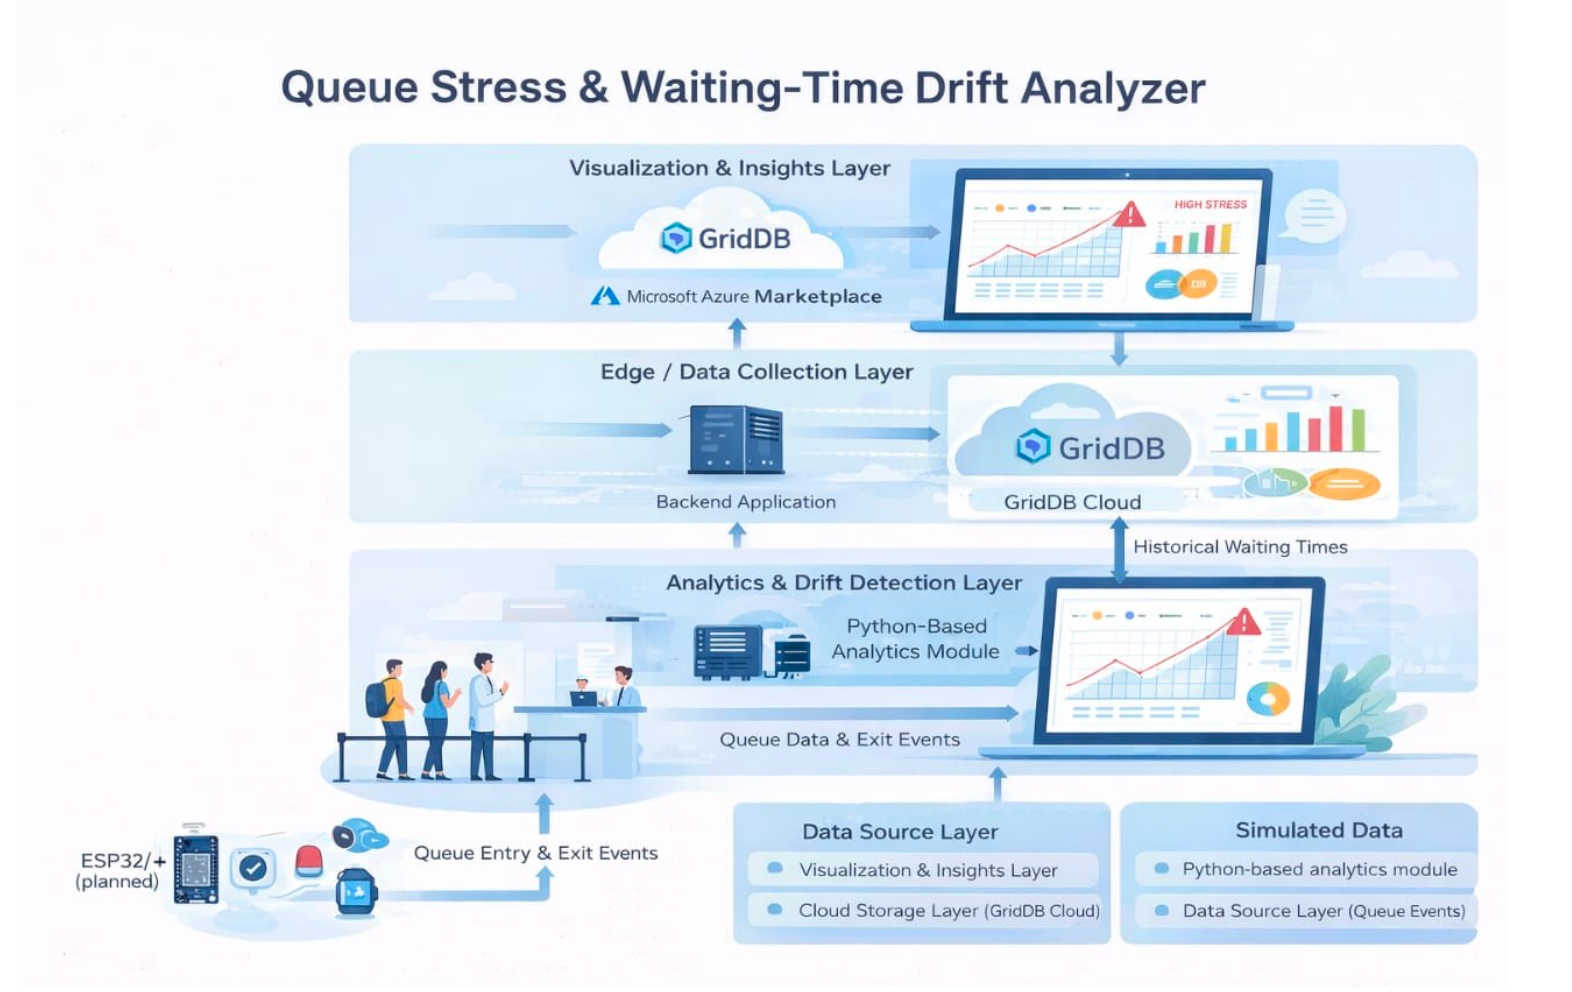
How We Plan to Build It
The system is planned to be developed using IoT data collection, cloud storage, and time-series analytics.
- Queue events will be captured using IoT sensors (such as ESP32-based entry/exit detection) or simulated data during initial testing
- Each event will be time-stamped and sent to a backend application
- GridDB Cloud, accessed via Microsoft Azure Marketplace, will store queue data as time-series records
- Python-based logic will analyze historical data to establish normal waiting patterns
- Waiting-time drift will be detected by comparing current values with historical baselines
- Basic visualizations and alerts will highlight service stress periods
GridDB Cloud plays a central role by enabling efficient historical comparisons across time windows.
Challenges We Anticipate
- Defining a meaningful metric to represent human stress using simple queue parameters
- Detecting gradual service slowdowns rather than sudden threshold violations
- Structuring time-series data efficiently for scalable analysis
- Keeping the system simple and demonstrable within hackathon constraints
These challenges will be addressed using lightweight analytics and GridDB Cloud’s optimized time-series capabilities.
What We Aim to Accomplish
- Propose a novel approach focusing on waiting-time drift instead of basic queue length
- Demonstrate real-world IoT analytics using GridDB Cloud
- Design a scalable solution applicable to hospitals, campuses, and public offices
- Highlight the social impact of data-driven service optimization
What We Expect to Learn
Through this project, we expect to learn:
- Practical use of GridDB Cloud for IoT time-series data
- How trend-based analysis provides better insights than static measurements
- Designing human-centric analytics systems for public infrastructure
- Building meaningful prototypes within a hackathon environment
What’s Next for Queue Stress & Waiting-Time Drift Analyzer
During the development phase, we plan to:
- Integrate real-time IoT inputs
- Improve stress and drift detection accuracy
- Build a simple visualization dashboard
- Validate the system using simulated real-world queue scenarios
- Explore scalability for large infrastructures such as airports and metro stations
Build With
- GridDB Cloud
- Microsoft Azure Marketplace
- Python
- ESP32 (planned)
- IoT Sensors / Simulated Data
- Time-Series Analytics
Proposed System Workflow
1. Queue Event Collection
The system observes queue behavior by detecting entry and exit events using IoT sensors (IR sensors, push buttons with ESP32) or simulated data during the hackathon phase.
- Entry event → person joins the queue
- Exit event → service completed
No personal identity or tracking is involved.
2. Time-Stamping of Events
Each entry and exit event is automatically assigned a timestamp at the moment it occurs.
The system focuses on when events happen, not who the person is.
3. Data Transmission to Backend
Collected events are transmitted to a backend application over Wi-Fi.
The backend acts as the interface between the data source and cloud storage.
4. Storage in GridDB Cloud
All time-stamped queue events are stored in GridDB Cloud as time-series data.
GridDB Cloud is optimized for:
- High-frequency event data
- Historical time-based analysis
- Fast comparison across hours and days
Each record represents a single queue event with its timestamp.
5. Waiting-Time Analysis
Using entry and exit events, the system analyzes:
- Arrival patterns
- Service completion patterns
From these, average waiting time is estimated over defined time windows (hourly, daily).
6. Baseline Behavior Learning
During initial observation, the system learns:
- Typical waiting time per hour of the day
- Peak and non-peak service patterns
These values form a baseline for future comparisons.
7. Waiting-Time Drift Detection
Current waiting-time trends are compared with historical baseline data stored in GridDB Cloud.
Gradual increases in waiting time without a corresponding queue-size increase are identified as waiting-time drift, signaling reduced service efficiency.
8. Stress Index Estimation
A simple Stress Index is calculated using:
- Average waiting time
- Queue density
- Time-of-day impact
This index represents the expected stress level during specific periods.
9. Visualization and Alerts
The system provides:
- Waiting-time trend graphs
- Stress-level indicators
- Alerts highlighting inefficiencies or stress-heavy periods
These insights enable proactive corrective action.
10. Future Enhancements
Planned extensions include:
- Real-time dashboards
- Camera-based or RFID inputs
- Predictive waiting-time analysis
- Deployment across large public infrastructures
Summary
This project demonstrates how GridDB Cloud–based time-series analytics can be used to understand queue behavior, detect service inefficiencies early, and improve public service experiences in a scalable, privacy-safe manner.