
🌾 AI-Powered Smart Agriculture Dashboard
🚀 Inspiration
Agriculture feeds the world, yet millions of farmers still depend on intuition instead of data. While working on IoT and AI projects, we realized that most farms—especially in rural areas—lack access to real-time soil and weather data.
We were inspired by the idea of empowering farmers with affordable, data-driven tools that combine IoT sensors, AI prediction models, and cloud scalability.
With GridDB Cloud’s ability to handle massive time-series data streams, we saw the perfect opportunity to build a real-time agricultural analytics platform that makes precision farming accessible to everyone.
🌱 What it does
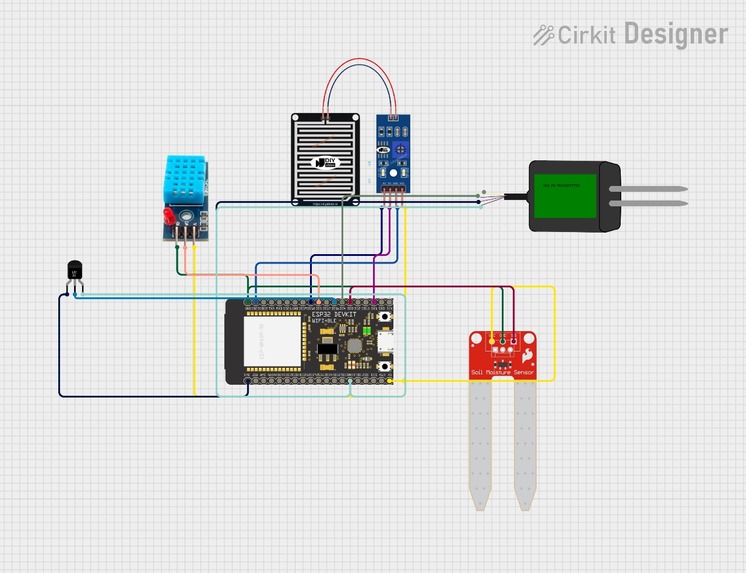
The AI-Powered Smart Agriculture Dashboard continuously collects data from IoT sensors—such as soil moisture, temperature, humidity, and light intensity—and streams it into GridDB Cloud.
Here’s what it delivers:
- Real-time monitoring: Displays live environmental data from the field.
- AI-based predictions: Uses machine learning models to predict irrigation needs, detect anomalies, and forecast potential crop stress.
- Smart alerts: Notifies farmers when conditions cross critical thresholds (e.g., soil too dry or humidity too low).
- Data visualization: Integrates with Grafana and a Flutter dashboard to show trends, insights, and performance metrics.
In essence, it transforms raw sensor data into actionable intelligence for smarter, sustainable farming decisions.
🧩 How we built it
We followed a modular approach, integrating IoT, AI, and cloud components step by step:
- Data Collection Layer: Built with ESP32 and DHT11/Soil Moisture sensors. Data is transmitted via MQTT protocol to a cloud endpoint.
- Data Storage & Management (Core): Used GridDB Cloud to store all incoming sensor data as time-series records. Leveraged its SQL-like query interface for real-time analytics and aggregation.
- Machine Learning Layer: Developed AI models in Python (Scikit-learn + TensorFlow) to analyze historical data and predict irrigation needs using regression techniques. We also experimented with anomaly detection models to identify unusual environmental behavior.
- Visualization & Dashboard: Created a Flutter web dashboard for cross-platform visualization. Integrated Grafana panels for trend and analytics visualization directly from GridDB Cloud.
- Alert System: Implemented a lightweight FastAPI backend to process AI model outputs and send alerts via email or SMS when thresholds were breached.
The architecture can be represented as:
IoT Sensors → GridDB Cloud → AI Engine → Dashboard & Alerts
⚡ Challenges we ran into
- Real-time data ingestion: Ensuring that sensor data streamed continuously without packet loss or delay was a big challenge, especially under poor network conditions.
- Model calibration: Training ML models that generalized well across different soil types and climates required iterative fine-tuning.
- Integration complexity: Connecting GridDB Cloud with both the backend API and visualization tools while maintaining low latency took multiple test cycles.
- Scalability simulation: Since we couldn’t deploy hundreds of sensors, we had to simulate large IoT data streams to test GridDB’s scalability and ingestion performance.
🏆 Accomplishments that we’re proud of
- Built a fully functional IoT-to-cloud data pipeline using GridDB Cloud.
- Developed an AI prediction system capable of real-time irrigation forecasting.
- Created a clean, responsive Flutter dashboard with live data visualization.
- Achieved stable ingestion of thousands of data points per minute in GridDB without performance degradation.
- Designed a solution that’s both technically strong and socially impactful, especially for rural farming communities.
📚 What we learned
- How to efficiently use GridDB Cloud for large-scale, high-speed time-series data management.
- The importance of data preprocessing before feeding sensor data to ML models.
- Practical experience integrating IoT → Cloud → AI → Visualization into one real-time ecosystem.
- Enhanced understanding of scalable architectures and real-time analytics pipelines for IoT workloads.
Mathematical Modeling We modeled soil moisture prediction using linear regression:
$$ M_t = \beta_0 + \beta_1 T_t + \beta_2 H_t + \beta_3 L_t + \epsilon_t $$
Where:
- $M_t$ = predicted soil moisture at time $t$
- $T_t$ = temperature
- $H_t$ = humidity
- $L_t$ = light intensity
- $\epsilon_t$ = error term
This helped us fine-tune irrigation predictions with measurable accuracy.
🔮 What’s next for AI-Powered Smart Agriculture Dashboard
- Integrate satellite weather data for improved crop and irrigation forecasting.
- Add drone-based plant health monitoring using computer vision.
- Expand the platform to a multi-farm ecosystem, enabling farmer networks to share data collaboratively.
- Deploy the dashboard as a progressive web app (PWA) with offline support for rural connectivity.
- Build a voice assistant interface in regional languages to make the system more accessible to local farmers.
Ultimately, we aim to scale this into a plug-and-play smart farming ecosystem—helping farmers everywhere make data-driven decisions for a greener, more sustainable future.
Built With
azure-iot-hub, esp32, fastapi, flutter, grafana, griddb-cloud, mqtt, pandas, python, scikit-learn, tensorflow